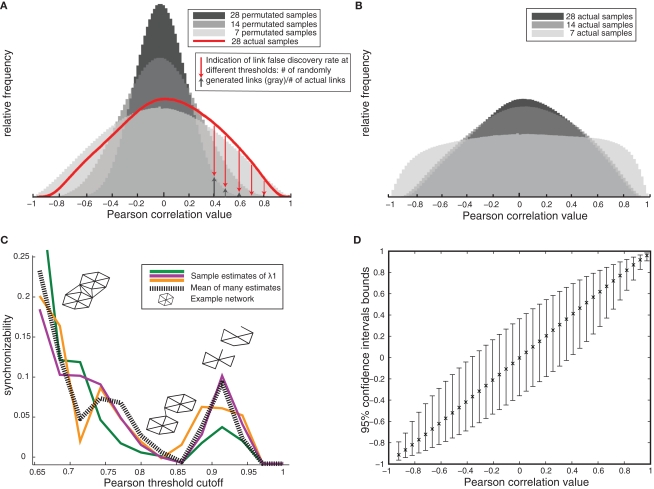
Figure 1.
Gene network validity and optimization – example from human amygdala (A) Decreasing spurious network links with increasing sample size is shown by the null correlation distributions in permutated samples decreasing toward zero with increasing sample size, and the greater number of high correlations in real versus permutated data (red). (B) Decreasing false-positive correlations in the actual data set with increasing sample size is shown as a decrease in the number of extreme correlations when comparing 7–14 samples. Correlation values then remains constant between n = 14 and n = 28 samples. (C) Example estimates of network synchronizability (low synchronizability implies high modularity) at various thresholds in order to optimize correlation cutoff (example estimates based on different subsets of nodes are shown in different colors). Inset: schematic of link pruning and changes in modularity shown for increasing cutoffs. (D) 95% confidence bounds on Pearson correlation values (estimated by resampling) later employed in testing for differential coexpression.

