Figure 4.
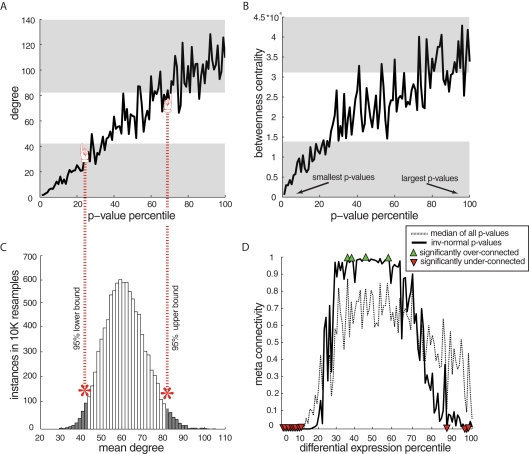
Examples and meta-analysis of network characteristics stratified by significance of disease-related differential gene expression. (A) Stereotypical trends in connectivity by p-value for differential expression in human amygdala data, showing rising connectivity with rising p-values and particularly low connectivity for the most DE genes (in all figures lowest p-values are to the left and transparent gray area shows non-random connectivity values). Here, two-group t-test p-values were used for differential expression in order to normalize analytical approaches across datasets. Results using complex statistical models in the amygdala dataset did not affect the outcome (not shown). (B) Betweenness centrality (a measure of how trafficked a particular node is by all shortest network paths) by p-values in amygdala indicates that the DE genes are not merely low-connected, but on the edge of the network, because low p-value genes have the lowest betweenness centrality. (C) An example of a null connectivity distribution is used to estimate the expected range of connectivity – each network has its own specific null distribution used to estimate bounds on expected connectivity. (D) Combined p-value by degree trends for all datasets (spanning species, disease, and array platforms). Meta-connectivity values close to 0 indicate less connectivity than expected for that percentile of DE genes in all datasets. Percentiles with non-random connectivity were estimated at alpha = 0.05 and 10% FDR.

