Figure 5.
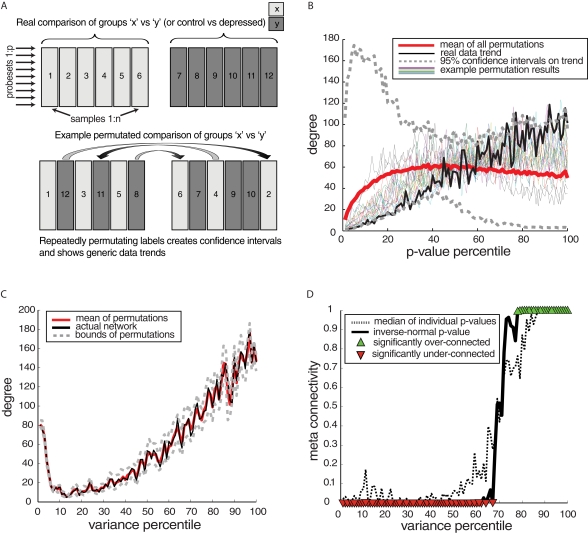
Disease specificity of differentially expressed (DE) gene connectivity patterns – example from human amygdala. (A) Schematic of method of data permutation to generate null comparisons, which contain no disease effect since control/disease samples are balanced. (B) Stereotypical and actual trends in connectivity by p-value, showing that the p-value-connectivity trend for DE genes is a generic trend of all comparisons, because the permutation bounds encompass the real comparison and because the mean permutation trend is similar to the actual trend. (C) Variability (transcript expression variance) plotted compared to degree – example from amygdala dataset (D) Meta-analysis of variability–connectivity relationship including all datasets.

