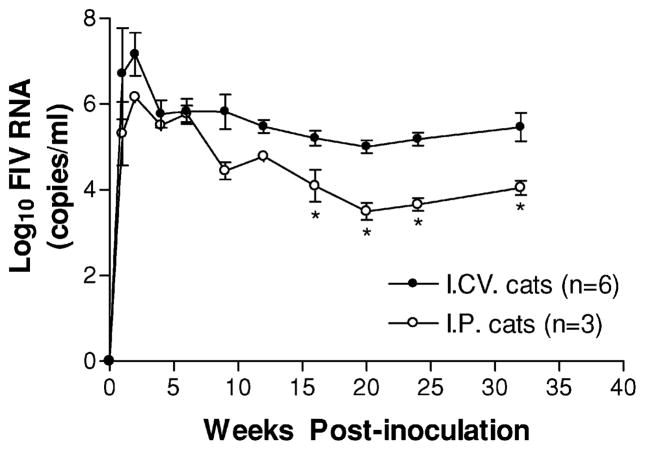
Figure 1.
Comparison of the average plasma viral loads of cats infected i.c.v. (n = 6) or i.p. (n = 3) with the same dose (2 × 10⁵ TCID50) of cell-free NCSU1 FIV at 0 week. RNA levels in plasma were determined by real time RT-PCR at the indicated time points. The plasma viremia appeared within the first week after infection and rapidly reached high levels (104 to 108 FIV copies/ml) 1 to 2 weeks after inoculation. After the initial viremia peak, plasma viral RNA dropped steadily. By 16 to 32 weeks the viremia in the i.c.v. cats stabilized at an average of 1.3 log10 higher than that of i.p. cats (P = .002). Values are mean ± SEM (* P < .05).

