
Figure 5.
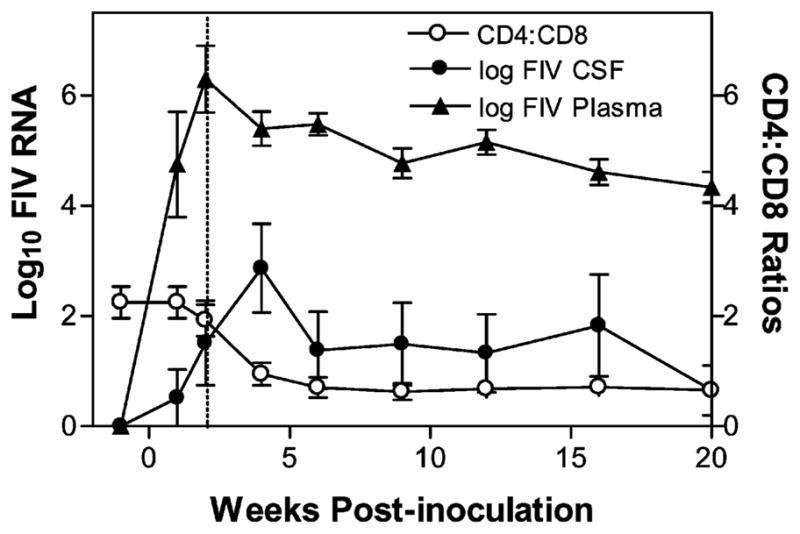
Comparison of the initial viral loads in CSF and plasma with the mean CD4+:CD8+ ratio in the six i.c.v. cats. The initial appearance of CSF virus followed the drop of plasma viremia and coincided with the decrease in the CD4+:CD8+ ratio. In contrast, the secondary virus peak that appeared in the CSF between 9 and 32 weeks p.i. occurred after the CD4+:CD8+ ratios had stabilized and were not correlated with any further changes in lymphocyte subsets. Values are mean ± SEM.