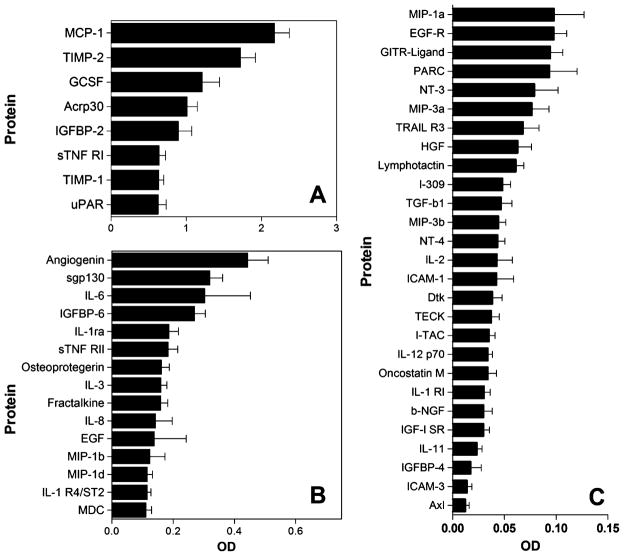
Fig. 3.
Summary of the mean ± SEM (n=16) protein expression in CSF from HIV-negative controls that were significantly above membrane blanks (p<0.01). a Eight proteins were expressed at very high levels in CSF. b Fifteen proteins were expressed at moderate levels (note the change in OD scale). c Twenty-seven proteins were expressed at low levels. The standard error values were generally low indicating good consistency across patients for most proteins

