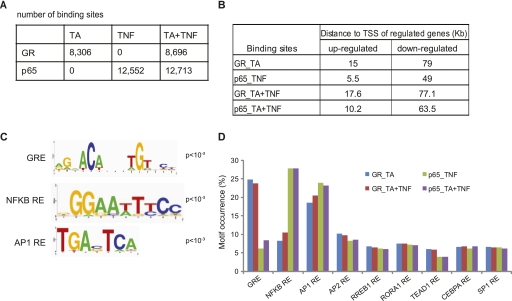
Figure 4.
Analysis of genome-wide GR- and p65-binding sites upon TA and/or TNF treatment. (A) The number of GR- and p65-binding sites identified upon TA, TNF, and TA + TNF treatment using the respective DMSO ChIP-seq data as control. (B) Median distance (in Kb) of GR- and p65-binding sites to the TSS of the nearest gene regulated by TA, TNF, and TA + TNF, as indicated. (C) Response elements for GR, NFKB, and AP1 identified as the predominant motifs in the GR and p65 binding sites. Motifs were identified by a de novo motif search and visualized using WebLogo. (D) Motif occurrence within the GR and p65 binding sites. The bar graph shows the percentage of GR and p65 sites containing the indicated motifs.

