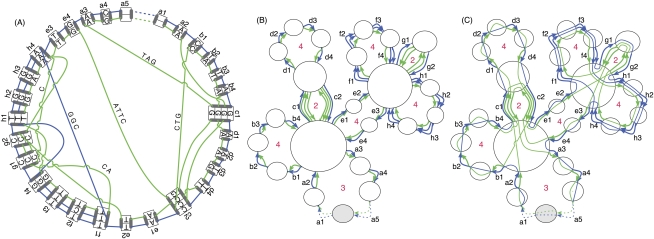
Figure 2.
(A) An adjacency graph G0 showing examples of threads. Blue and green lines depict two homologous threads traversing a series of residues in blocks and the joining adjacencies. The block edges are the aligned boxes containing letters. The stub edges are the aligned boxes not containing letters. The ends of the blocks/stubs are mapped as filled black rectangles on the edges of the aligned boxes. The adjacency edges are sets of lines connecting nodes. To distinguish the backdoor adjacencies, they are dotted. DNA bases within the adjacencies are written along the lines representing adjacency edges. Starting at a1, the blue thread gives the sequence ACTTAGAATTCATTTTGCCTGGAGGCTCTGTGGATGAC. Similarly, the green thread gives the sequence AGCCTGCATAGAAGTCATggCATTTGTGAAggCTGATTCccctaAG. The lowercase letters represent the reverse complement of the block residues and adjacency sequences as they are written, and result from the traversal of the adjacency/block in the reverse orientation from right to left. (B) The Cactus graph G for G0. The blue and green lines again depict the two threads. Each node is shown as a circle; the origin node is colored gray. The block/stub edges are depicted with multiple arrows, representing the different threads traversing them. Stub edges are dotted. The red numbers indicate the length of the chains. (C) The Cactus graph with embedded net substructure (G0, G). Each node in (G0, G) has added adjacency edges drawn, which connect the block end nodes represented by the ends of the block edges incident with each node. The origin node in (G0, G) is drawn containing the origin node from G0 to connect the prefix and suffix adjacency substructure.

