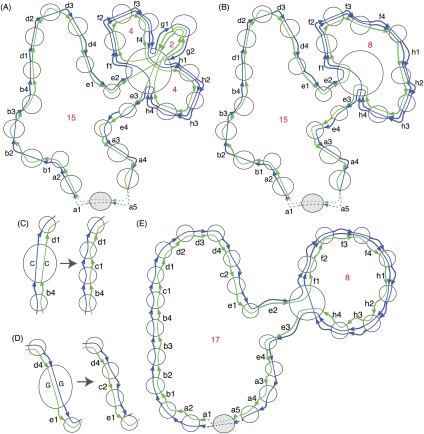
Figure 3.
Melting and annealing examples. (A) An example showing the results of melt((G0, G), X), where (G0, G) is the Cactus graph in Figure 2C and X = {c}. (B) Like A, but with chain g also removed. (C,D) Examples of the effect of anneal((G0, G), ∼∼), where (G0, G) are the Cactus graphs in B and ∼∼ contains the alignments in chain c of the Cactus graph in Figure 2B added. (E) The MSLC solution for the Cactus graph in Figure 2C with large chain threshold α = 8. This is the result of the annealing function illustrated by C and D. The length of the longest chain in B increases by 2.

