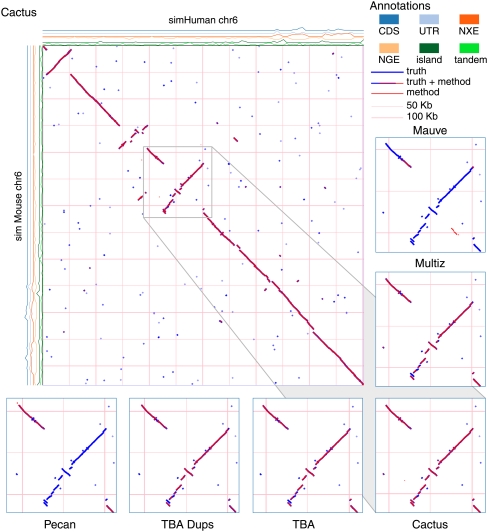
Figure 5.
A dot plot showing the Evolver mammals alignment of simMouse and simHuman. The true alignment is shown in blue, and overlaid in red is the predicted Cactus alignment. The density of different sequence annotations, as maintained by the Evolver model, are plotted on rows along the axes. (CDS) Coding sequence; (UTR) untranslated region; (NXE) non-exonic conserved regions; (NGE) non-genic conserved regions; (island) CpG islands; (tandem) repetitive elements. The gray box is expanded at the bottom of the figure for five different predicted alignments. Only the Cactus alignment correctly identifies the tandem duplication at the bottom left of the expanded region.

