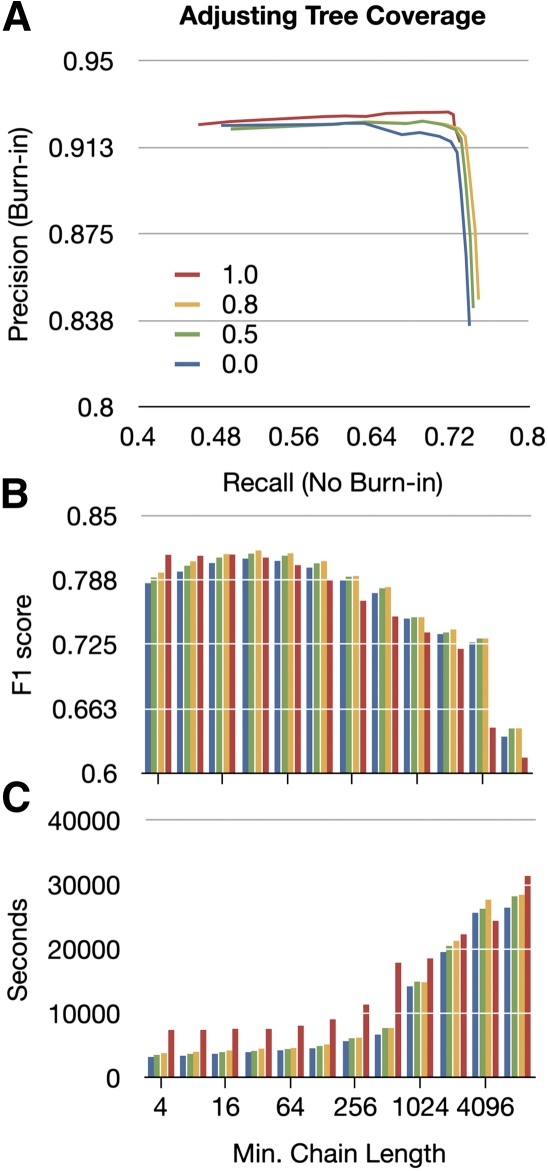
Figure 9.
The effects of adjusting tree coverage. (A) A precision-recall plot of the predicted Cactus alignments showing the effect of altering α in powers of 2 from 4 to 8192. Four curves are plotted, showing changes in minimum tree coverage from 0 to 1.0 (see key in A). (B) The F1 score as a function of α for the four different minimum tree coverages (colors consistent with A). (C) As in B, but showing time.

