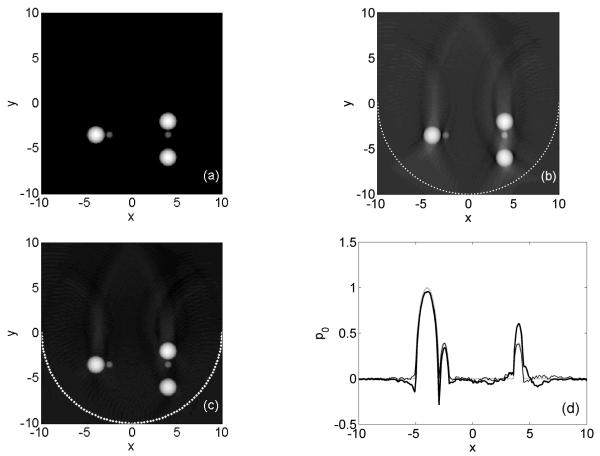
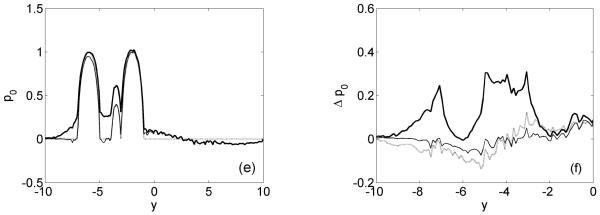
Figure 4.
Simulation of 2D imaging. (a) Original phantom. Image reconstruction (b) with 1/Ω0(r) weighting and (c) with smooth weight factors. The arc shaped detection curve is indicated as a dashed white line. (d) Horizontal profile at y = −3.5. (e) Vertical profile at x = 4. Dotted line: original, bold solid line: with 1/Ω0(r) weight, thin solid line: with smooth weight factors. (f) Difference Δp0 between vertical profiles of reconstructed and original pressure for y < 0. Bold solid line: 1/Ω0(r) weight, dotted line: 1-0-window, thin solid line: with smooth weight factors.


