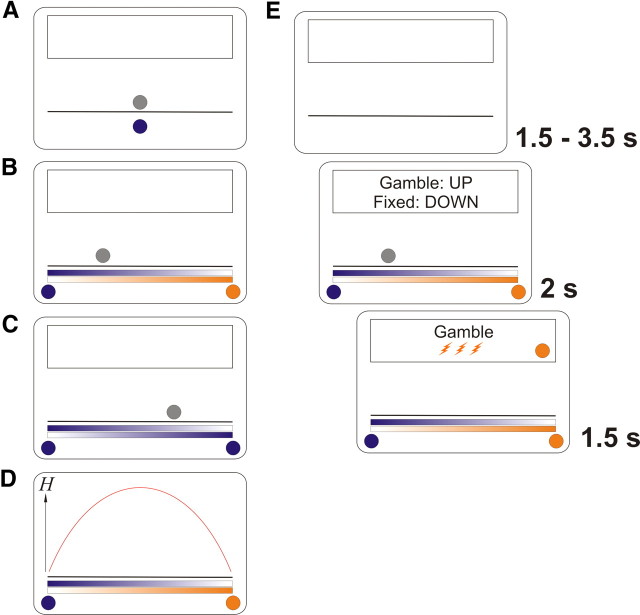
Figure 1.
Experimental setup. A, Preceding learning task. In each of 144 trials, participants saw a colored ball. Each of three ball colors represented a gamble (framed as “lottery ticket”) with a different first-order probability (0.2, 0.5, 0.8) of getting three electric shocks, or nothing. Participants chose between that gamble and one certain electric shock of the same magnitude. A fading gray silhouette directly above it indicated the time that was allowed for the decision. B, Experiment proper. On each of 276 ambiguous trials, two colored balls appeared, indicating two possible first-order probabilities. It was explained that these balls represented two bowling ball players, one of which would play his ball that would be shown as a silhouette. Thus, the closer the silhouette appeared to one of the two balls, the more likely it was to represent this ball. Again, a decision had to be made between the gamble and one certain shock. C, In 84 additional nonambiguous trials, the two balls had the same color. The position of the gray silhouette is uninformative in this case. D, Second-order uncertainty, quantified as Shannon entropy H of the second-order probabilities of which conditional first-order probability would be realized, given the silhouette position. It can be seen that this quantity is highest in the middle between the two balls. E, Timeline. After a variable intertrial interval, the gamble was presented, together with an indication of which key to press (this was held constant within participants and varied between). While the silhouette faded out, a decision had to be made within 1.5 s (behavioral experiment), or 2 s (imaging experiment). The choice, the ball that was being played, and the ultimate outcome, were then shown in the feedback box above the bowling ball lane.

