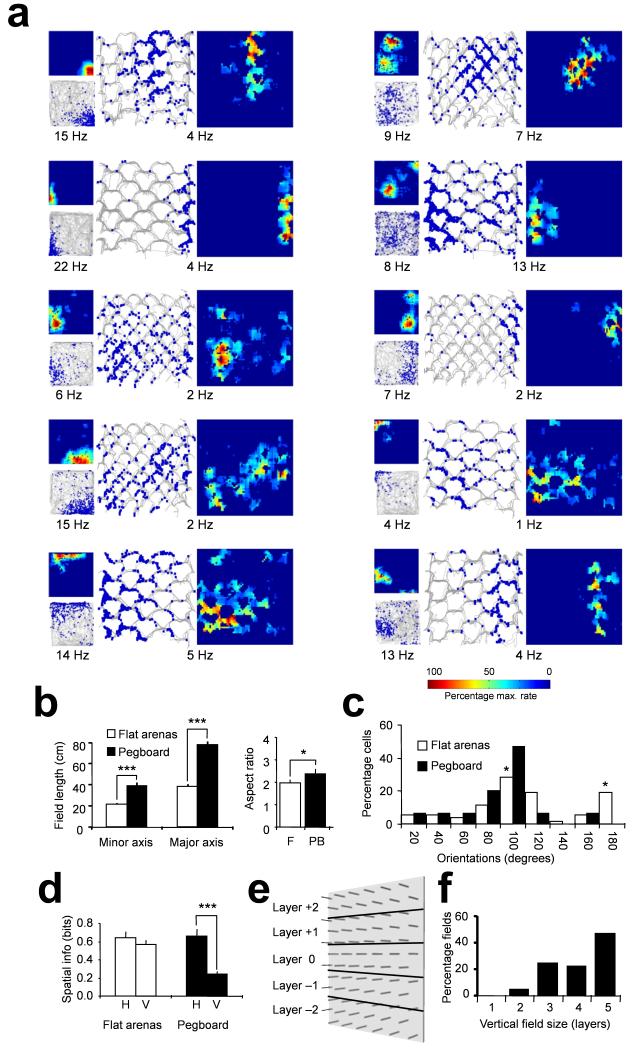
Figure 1.
Place fields on the pegboard. (a) Firing fields of 10 hippocampal place cells recorded in 60cm square horizontal environments and on the 1.2 m square vertical pegboard. Each field is shown as raw data (black traces = rat’s path, blue squares = superimposed action potentials) and as smoothed contour plots with peak rate (Hz) in white text. Colour bar shows percentages of peak firing. (b) Length (mean +/− s.e.m.) of the major (long) and minor (short) axes, and aspect ratios (mean +/− s.e.m.), of fields in the flat arenas and pegboard. F = Flat, PB = pegboard. * = p < 0.05, *** = p < 0.0001. (c) Orientations of place fields in the two environments. In the flat arenas (light blue), 90 degrees was arbitrarily aligned with one pair of arena walls. Place field orientation showed two peaks (asterisks) at 90 and 180 degrees, reflecting the tendency of place fields to align with walls. On the pegboard (dark blue), almost all fields aligned vertically (90 degrees). (d) One-dimensional spatial information content (mean +/− s.e.m.) for firing rate maps collapsed horizontally (H) or vertically (V), in either flat arenas (H and V arbitrarily chosen) or on the pegboard, showing significantly less information in the vertical dimension on the pegboard. (e) Diagram of the pegboard, showing the analysis layers (labelled according to a hypothetical cell with field peak in the central layer). (f) Percentages of firing fields having different vertical extents (specified as layer span).

