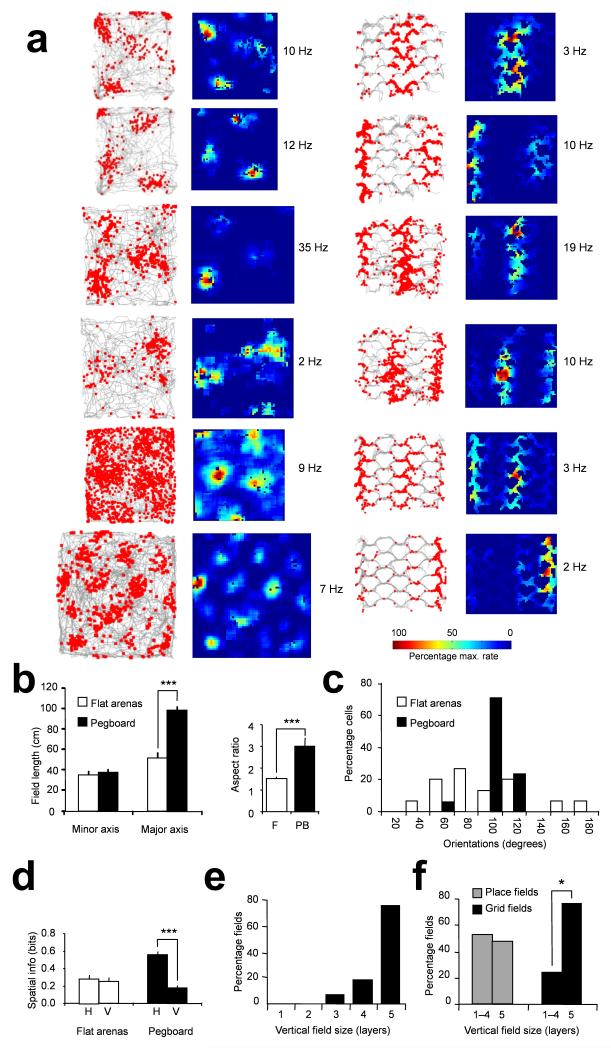
Figure 2.
Grid fields on the pegboard. (a) Firing fields of 12 grid cells on the flat arenas (left plots) and on the vertical pegboard (right plots). Fields are as described in Fig. 1a except that spikes are red. In the flat environments, firing fields were multiple and arranged approximately in a hexagonal close-packed array. On the pegboard, by contrast, the fields tended to be aligned in one or more vertical stripes. Peak rates (Hz) in white text. Colour bar shows percentages of peak firing. (b) Field sizes and aspect ratios (mean +/− s.e.m.). On the pegboard, and by contrast with the place cells (Fig. 1b), the major axis increased in size whereas the minor axis did not, with a consequent increase in aspect ratio. (c) Orientation of the grid fields, illustrated as in Fig. 1c. (d) Spatial information content (mean +/− s.e.m.) as shown in Fig. 1d. (e) Percentages of firing fields having different vertical extents (specified as layer span). (f) Comparison of number of place and grid fields spanning all 5 layers vs. fewer (* = p < 0.05).

