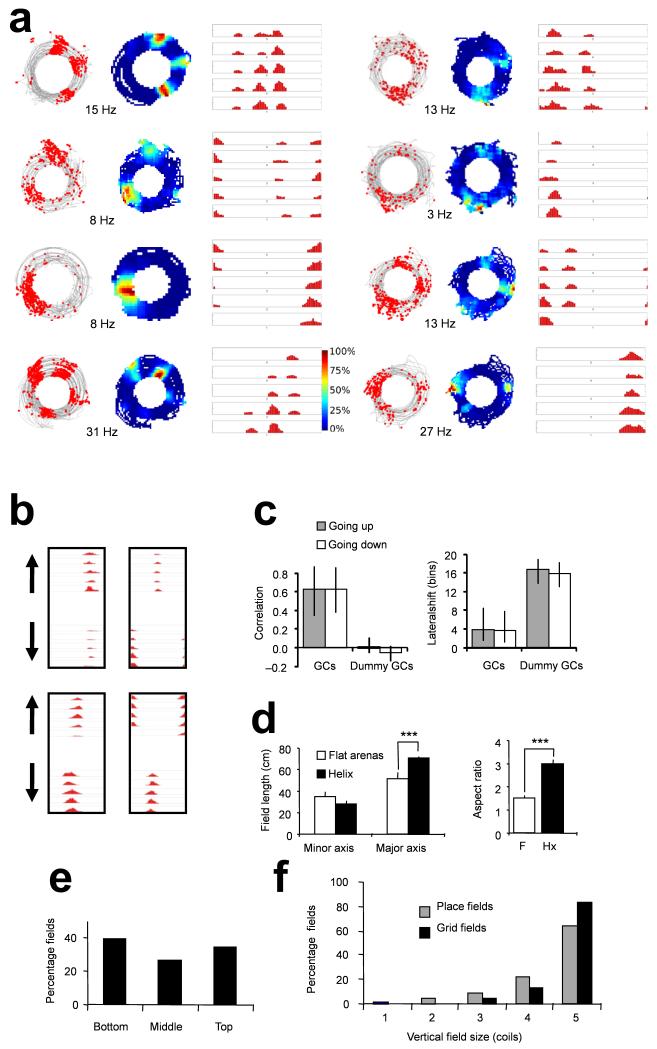
Figure 4.
Grid fields on the helix. (a) Firing patterns of 8 grid cells on the helix, (details as in Fig. 3a but with spikes in red). Peak rates (Hz) are shown in black text for the overhead rate maps. Colour bar shows percentages of peak firing. (b) Grid cell coil-by-coil rate histograms, showing up-going and down-going runs separately, for 4 cells that showed significant directional modulation. (c) Between-coil field correlation (median +/− quartiles) for grid fields vs. dummy grid fields (left) and lateral shift (median +/− quartiles) that maximised between-coil correlations for grid fields and dummy grid fields (right), decomposed into up-going (. (d) Major (long or vertical) and minor (short or horizontal) field axes (left), and aspect ratios (right), for grid fields on the helix vs. the flat environments (mean +/− s.e.m.). F = Flat, Hx = Helix. (e) Distribution of grid field peaks across the vertical extent of the helix. (f) Vertical field size comparison for place vs. grid cells, showing increased tendency for grid cells to have fields that span the entire vertical extent of the helix.

