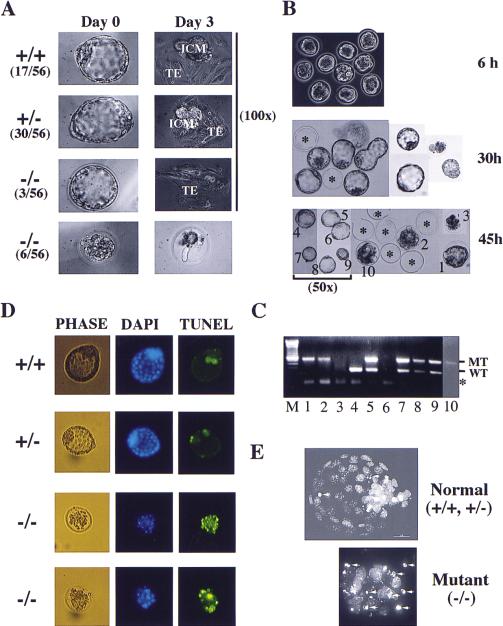
Figure 2.
In vitro culture of preimplantation embryos. (A) In vitro culture of blastocysts isolated from CHK1+/− intercrosses. A typical image at day 0 and day 3 are shown along with the percentage of each category. (TE) Trophoectoderm; (ICM) inner cell mass. All images are 320× except when otherwise indicated. (B) In vitro culture of eight-cell morula. Shown here are a litter of 10 embryos isolated from a CHK1+/− intercross. The images were captured at 6, 30, and 45 hr in culture (100× except when otherwise indicated). The asterisks indicate the empty zona pellucida after the embryos have hatched. The embryos were individually picked and labeled 1–10. Embryos 1, 2, 3, and 10 failed to hatch. (C) PCR genotyping of embryos from B. The lane numbers correspond to that of the embryos. Embryo 6 was lost during transfer and embryo 3 was too degenerate to give any products. (WT) Wild type; (MT) mutant. The asterisk indicates a nonspecific band generated by primers alone. (D) TUNEL analysis of blastocysts derived as described in B (100×). (E) Confocal images (DAPI, 1000×) of blastocysts analyzed in D. The arrows indicate condensed and fragmented nuclei.

