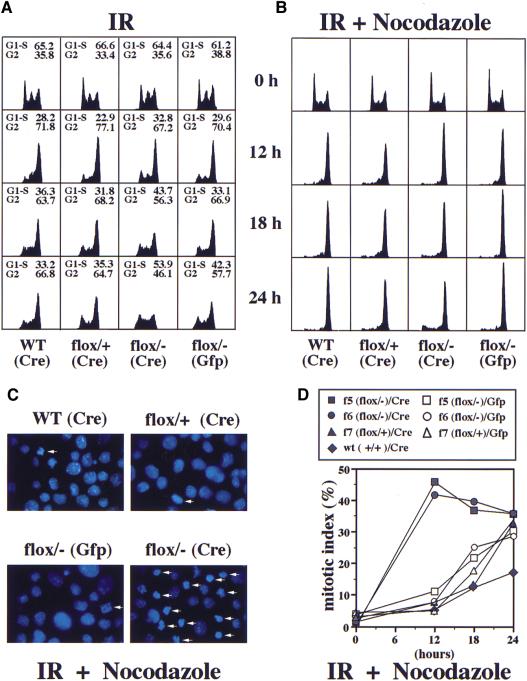
Figure 4.
CHK1−/− cells are defective for the G2/M DNA damage checkpoint. (A) FACS (DNA content) analysis of irradiated GFP- or Cre-transfected CHK1+/+, CHK1flox/+, and CHK1flox/− cells. Twenty-four hours after transfection, cells were subjected to 10 Gy IR, harvested at 0, 12, 18, and 24 hr and stained with PI. The percentage of G1–S and G2 population (mitotic cells are included in the G2 counts but are generally a small proportion) is shown above each FACS sample. (B) FACS (DNA content) analysis of IR and nocodazole-treated cells. Cells of the indicated genotypes were transfected and irradiated as in A and incubated in nocodazole (0.2 μg/ml) containing media 30 min after irradiation. (C) Images (1000×) of the DAPI-stained 12-hr samples in B. Arrows indicate mitotic cells with condensed chromosomes and no nuclear membrane. (D) A mitotic index graph of IR and nocodazole-treated cells described in B and C. Cells (250–300) were counted for each sample. GFP or Cre transfections are indicated by open or closed circles. f5 and f6 represent two independent CHK1flox/− cell lines and f7 is a control CHK1flox/+ cell line.

