Figure 10.
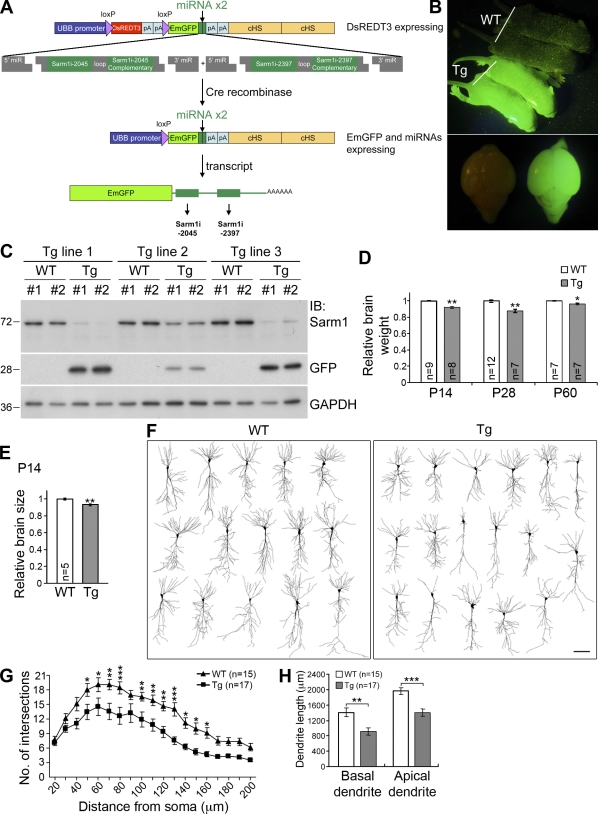
Reduction of Sarm1 in vivo impairs dendritic arborization. (A) Strategy used to generate Sarm1 knockdown mice; details are described in Materials and methods. (B) GFP expression in P5 Sarm1 knockdown transgenic (Tg) mice. (C) Reduction of Sarm1 protein levels in three independent Tg mouse lines. Immunoblotting was used to determine the protein levels of Sarm1 and GFP in the extracts containing forebrain and subcortical regions. For each line, two GFP-positive Tg and two wild-type (WT) littermates were examined. GAPDH was used as an internal control. Molecular mass standards (kD) are indicated next to the gel blots. (D) The relative brain weights of Sarm1 knockdown mice and WT littermates. P14, P28, and P60 mice were analyzed. *, P < 0.05; **, P < 0.005. (E) Total brain area of P14 mice. Sums of the total areas of a series of brain sections were determined to compare the brain size of Sarm1 knockdown mice and WT littermates. **, P < 0.005. (F) Cell morphology of CA1 neurons. 2-mo-old mice were used for Golgi-Cox staining. Camera lucida was then performed to examine neuronal morphology in the brain. Bar, 50 µm. (G) Sholl analysis of CA1 neurons. *, P < 0.05; **, P < 0.01; ***, P < 0.001. (H) Total length of basal and apical dendrites of CA1 neurons. **, P < 0.005; ***, P < 0.0005. The data represent mean values ± SEM (error bars).

