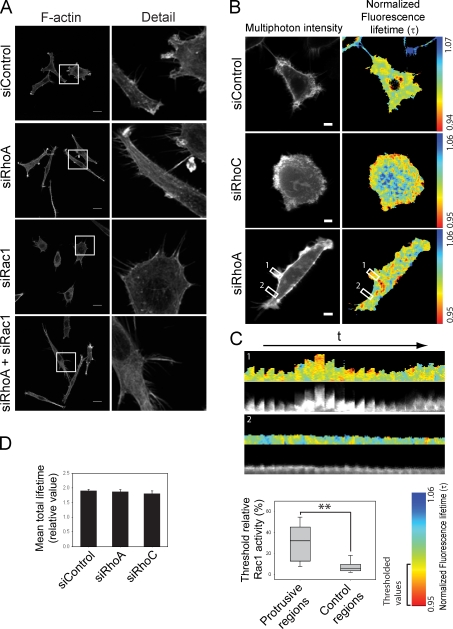
Figure 3.
RhoA inhibits Rac1-driven protrusive activity. (A) F-actin distribution in PC3 cells after transfection with siRNAs. Boxed regions are shown at higher magnification on the right. Bars, 20 µm. (B) FLIM images from PC3 cells cotransfected with the Rac1 biosensor and indicated siRNAs. Higher Rac1 activity is shown in “warmer” colors. Bars, 10 µm. (C, top) Kymographs of boxed regions in B: protruding membrane region (1) and control nonprotruding region (2); 1 frame/min (20 min), t = time. (C, bottom) Graph of threshold relative Rac1 activity values in protruding and control regions; **, P < 0.01. (D) Mean total Rac1 biosensor lifetime of cells transfected with the indicated siRNAs. Error bars indicate ± SEM.

