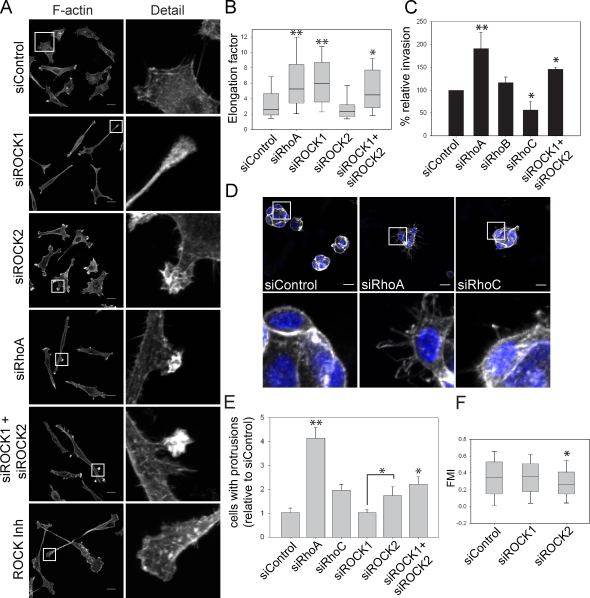
Figure 4.
ROCK1 and ROCK2 regulate different aspects of the RhoA morphological response. (A) F-actin distribution in PC3 cells after transfection with the indicated siRNAs or ROCK inhibitor Y-27632 treatment. Boxed regions are shown at higher magnification on the right. Bars, 20 µm. (B) Elongation of PC3 cells. (C) Transwell invasion assay. (D) PC3 cells embedded in Matrigel stained for F-actin (gray) and nuclei (DAPI; blue). Enlarged views of the boxed regions are shown below. Bars, 20 µm. (E) Quantification of cell groups (see D) with more than two F-actin–rich protrusions. (F) Forward migration index (FMI) of PC3 cells in a chemotaxis assay. **, P < 0.001; *, P < 0.01. Graphs show pooled results from experiments performed with at least two different siRNAs for each gene as indicated in Materials and methods. Error bars indicate mean ± SEM.

