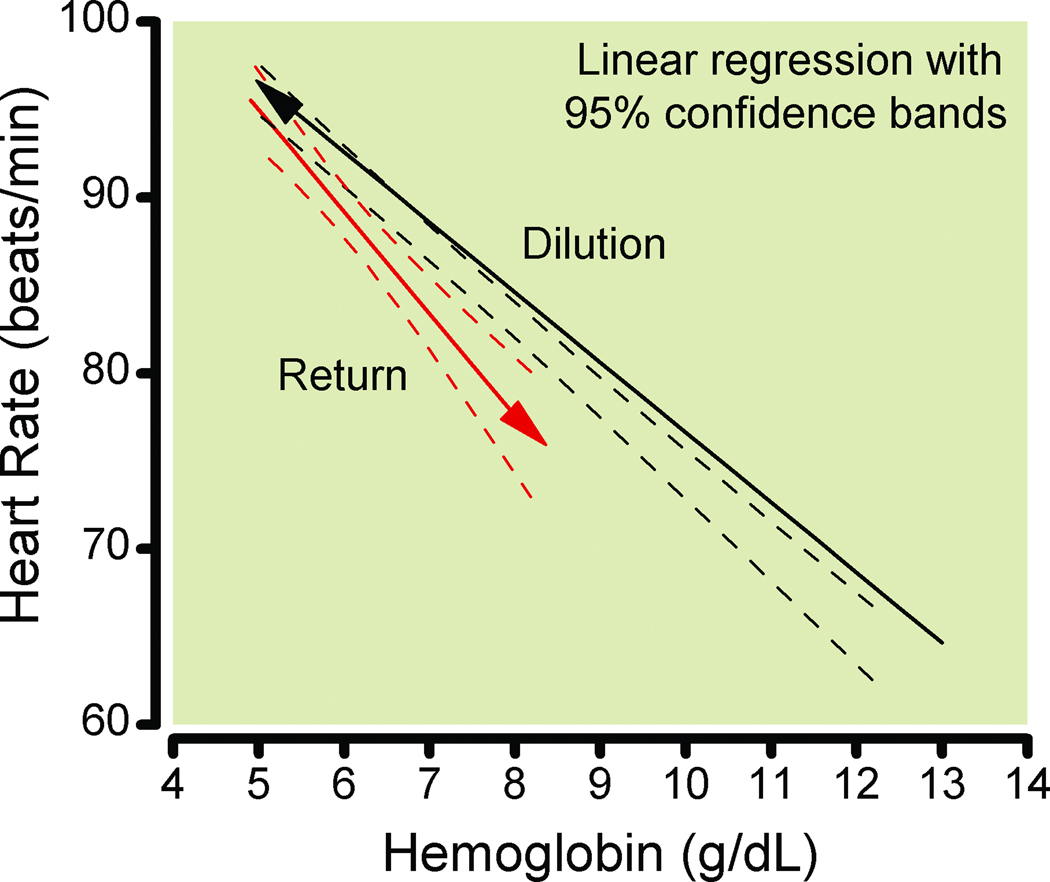
Figure 2.
Linear regressions for the 33 individuals that had at least 2 hemoglobin values after transfusion. The solid line is the regression for these subjects during isovolemic hemodilution, with 95% confidence bands. The dashed line is the regression for the same individuals during transfusion of their autologous red blood cells, with 95% confidence bands. Heart rate during dilution differed significantly from return of erythrocytes, P = 0.009. Isovolemia was not maintained with return of erythrocytes.

