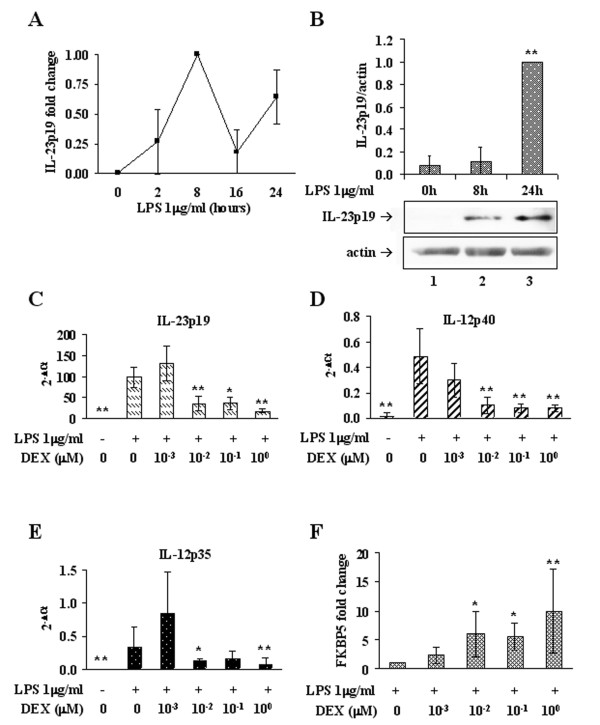
Figure 1.
DEX affects IL-23 mRNA levels. (A) Time course of IL-23p19 expression in Mφ stimulated with 1 μg/ml LPS for the indicated times. Relative quantification was performed by Real Time RT-PCR according to the ΔΔCt comparative method and data are expressed as fold changes compared to the peak sample (LPS 8h). Data reported in diagram are the average of three independent experiments. (B) Time course of IL-23p19 protein accumulation in Mφ after 24h of stimulation with 1 μg/ml LPS. Western immunoblotting were performed on total cellular extracts. Images are representative of three independent experiments and data are reported in bar graph as fold changes compared to the peak sample (LPS 24h). IL-23p19 signal (upper panel) was normalized to the actin signal (lower panel). (C),(D),(E) DEX-dependent inhibition of expression of the interleukin subunits IL-23p19, IL-12/IL-23p40 and IL-12p35, respectively. Real Time RT-PCR was performed on LPS-stimulated Mφ treated with increasing concentrations of DEX. Results are reported as raw 2^-(Ct target-Ct reference) to compare the relative abundance of each subunit. Amplification efficiencies of p19 and p35 were comparable, based on the slopes of their standard curves. n = 3. (F) Induction of FKBP5 by DEX in Mφ treated as in (C). Real Time RT-PCR data are reported as fold changes compared to the DEX-untreated sample; n = 6. * p < 0.05, ** p < 0.01.

