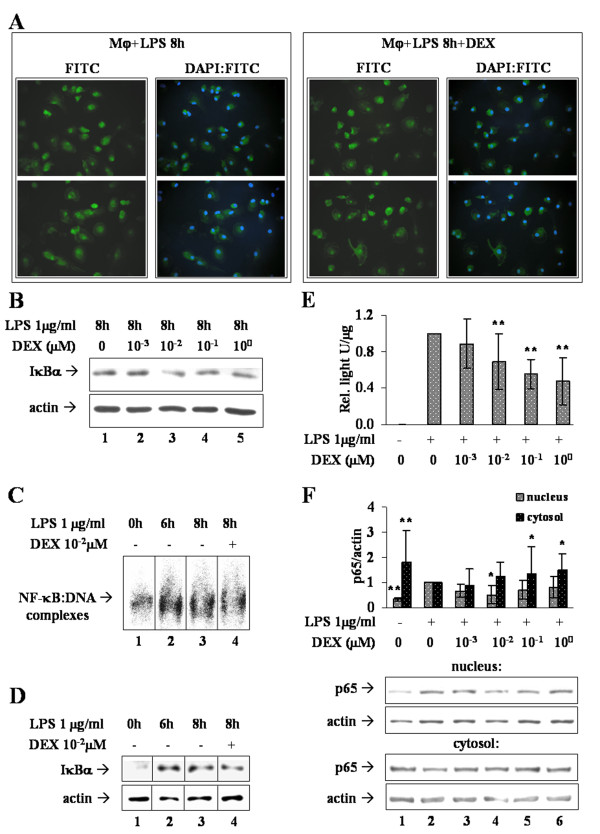
Figure 3.
Mechanism of NF-κB activity restraint by DEX. (A) Immunofluorescence analyses of NF-κB-p65 sub-cellular localization. FITC pictures show p65 signal in two representative fields of Mφ stimulated 8h with LPS (left box) or of Mφ stimulated 8h with LPS and treated with 0.01 μM DEX (right box). DAPI:FITC pictures were obtained by overlay of the FITC and DAPI signals, and show the nuclear localization of p65. (B). LPS-stimulated Mφ (lane 1) were treated with increasing concentrations of DEX (lanes 2-5) and the amount of IκBα was analyzed by western immunoblotting (upper panel), normalized to the actin signal (lower panel). Image is representative of three independent experiments. (C). Mφ (lane 1, 0h) were subjected to NF-κB EMSA after LPS stimulation for 6h (lane 2) and 8h, in presence (lane 4) or absence (lane 3) of DEX 0.01 μM. The image is representative of four independent sets of samples, each run in triplicate. (D) IκBα western immunoblotting on the same samples employed for EMSA, representative of four independent experiments. (E) NF-κB reporter assay on MM6 cells. NF-κB-driven transcription was triggered by LPS 1 μg/ml for 1h, followed by treatment with indicated DEX concentrations. Data of relative light units/μg of proteins are reported in bar graph as fold changes compared to the DEX-untreated sample (+LPS, 0 DEX); n = 12. (F) NF-κB p65 western immunoblotting on cytosolic and nuclear extracts from the same cells as in (E). Densitometric analysis was followed by normalization on the internal control represented by actin. Data are reported in bar graphs as fold changes relative to the DEX-untreated sample (lane 2); n = 6. * p < 0.05, ** p < 0.01.

