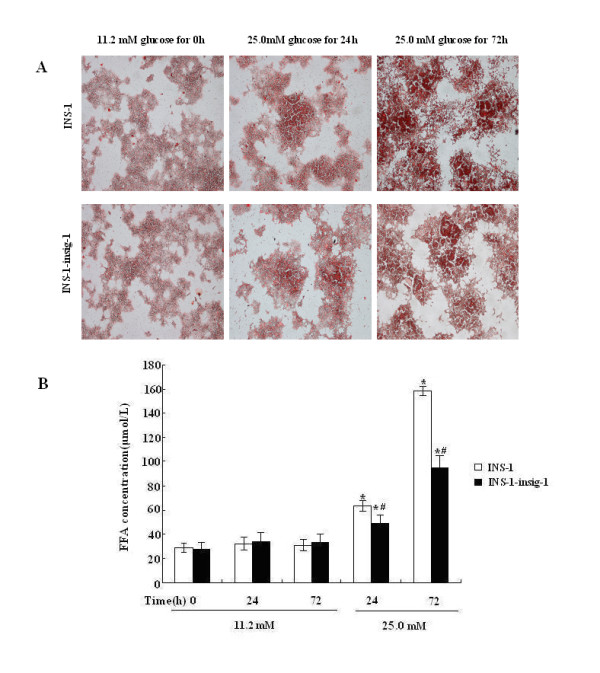
Figure 6.

Detection of intracellular lipid droplets in INS-1 cells by light microscopy and FFA measurement. The INS-1 and INS-1-Insig-1 cells were exposed to 11.2 mM or 25.0 mM glucose for 0, 24 and 72 h. A) Oil Red O staining. The lipid droplets are stained dark red. (Magnification × 100) B) FFA concentration in the medium was measured by ELISA. * P < 0.05; ** P < 0.01 VS exposed to 11.2 mM glucose at the same time point; # P < 0.05 VS INS-1 cells at the same time point.
