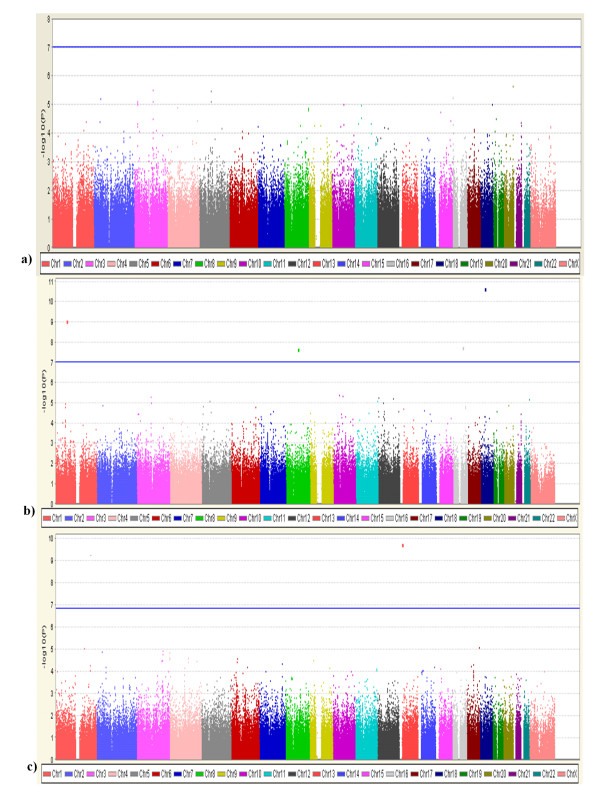
Figure 2.
Manhattan plot for results of GWAS. a) Ashkenazi Jewish, b) NINDS and c) CIDR/Pankratz et al 2009. Manhattan plot of GWAS results of testing for association with PD. Horizontal axis is the genomic position, and vertical axis is -log10 (p-value) in 3 datasets. Blue line indicates the threshold of genome-wide significance level (Ashkenazi Jewish, p = 9.5×10⁻⁸; NINDS, p = 9.7×10⁻⁸; CIDR/Pankratz et al 2009, p = 1.5×10⁻⁷).

