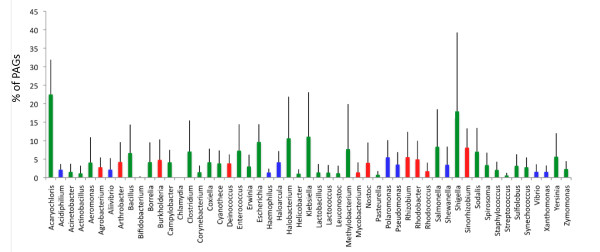
Figure 3.
Taxonomical distribution of PAGs. Relative PAGs abundance and standard deviations across the most represented genera of the dataset. Red and green bars represent statistically PAGs depleted and enriched genera, respectively. Blue bars represent genera for which the content of PAGs was not statistically different from that expected by chance.

