Figure 1.

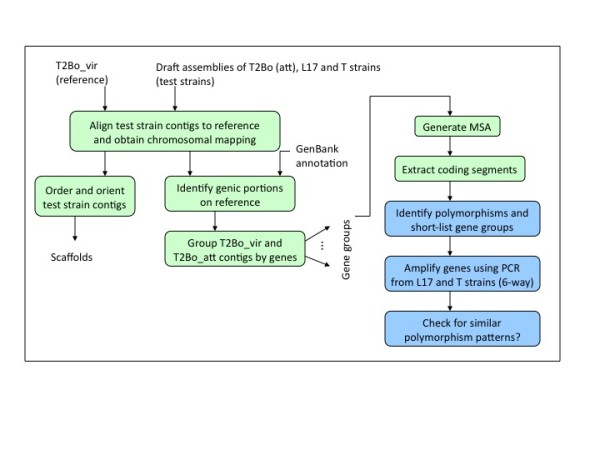
Flowchart for comparative gen-centric (genic) analysis. Green boxes indicate computational steps and blue boxes denote steps that require manual intervention.

Flowchart for comparative gen-centric (genic) analysis. Green boxes indicate computational steps and blue boxes denote steps that require manual intervention.