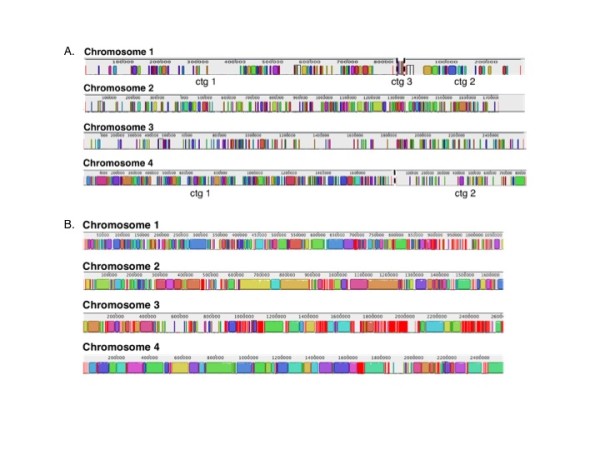
Figure 2.

Global chromosomal consensus alignments between all virulent (A) and attenuated (B) strains of T2Bo, L17 and T virulent. Chromosomes are not drawn to scale. Color blocks represents individual assembled contigs. Gaps on chromosomes represent sequences that are missing in at least one of the strains in the corresponding group. Smaller contigs (ctg) on chromosome 1 (n = 5) are omitted for the virulent strain alignments.
