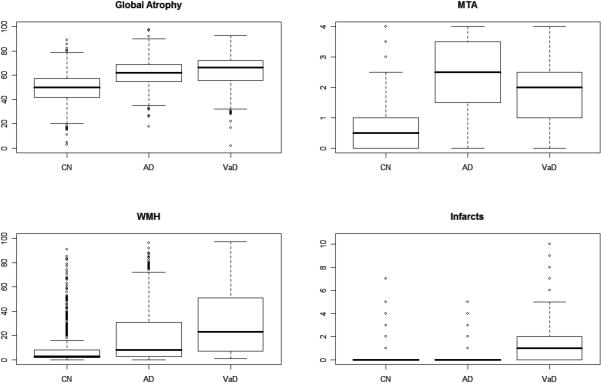
Figure 1. Box plots of global cerebral atrophy ratings, medial temporal atrophy, white matter hyperintensity, and number of infarcts.

CN=cognitively normal, AD=Alzheimer's disease cases, and VaD=vascular dementia cases. Bold lines represent median, boxes show inter-quartile ranges. Whiskers extend to data within 1.5 times the inter-quartile range from the box. Outliers (points >1.5 times the inter-quartile range) are presented as circles.
