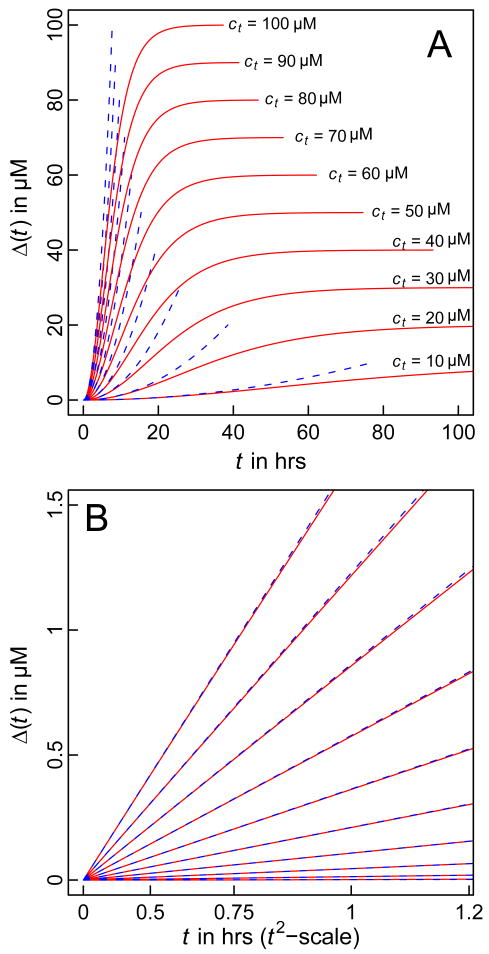
Figure 1. Simulated time course for aggregation.
Panel A shows the entire time course of aggregation according to Equation (7) (blue dashed curves) and Equation (9) (solid red curves). Panel B shows a magnification focusing on the early time course and demonstrates the validity of the t2 dependence for Δ(t) during the early stages. In the interest of clarity, Δ(t) is plotted against t2 in panel B and in both panels, each pair of curves (red and blue) corresponds to a specific value for ct and these values are shown in panel A.

