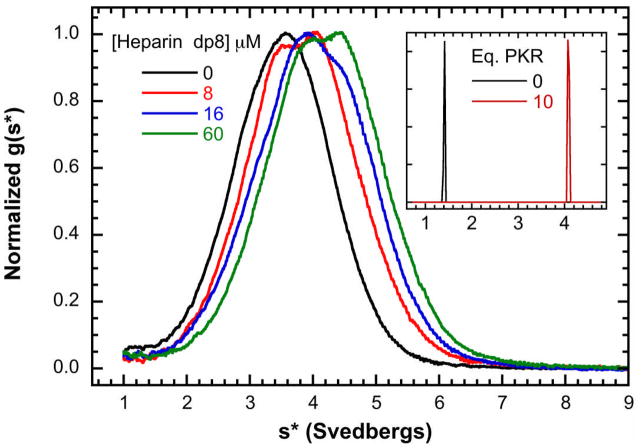
Figure 2.
Sedimentation velocity analysis of dp8 binding to PKR. A) Normalized g(s*) distributions obtained at a fixed concentration of PKR (16 μM) with the indicated concentration of of dp8: 0 μM (black), 8 μM (red), 16 μM (blue) and 32 μM (green). The distributions are normalized by peak maximum. Conditions: rotor speed, 50,000 RPM; temperature, 20°C; inteference optics; scan interval, one minute. Note that the free dp8 is not resolved in these distributions because the the scan range was chosen to emphasize the higher-s features and diffusional broadening reduces resolution of the low-s region in the time derivative method. Inset: bdp8 binding to PKR analyzed by fluorescence-detected sedimentation velocity. c(s) distributions of 250 nM bdp8 (black) and 250 nM bdp8 + 10 eq. PKR (red). Conditions: rotor speed, 50,000 RPM; temperature, 20°C; fluorescence optics.

