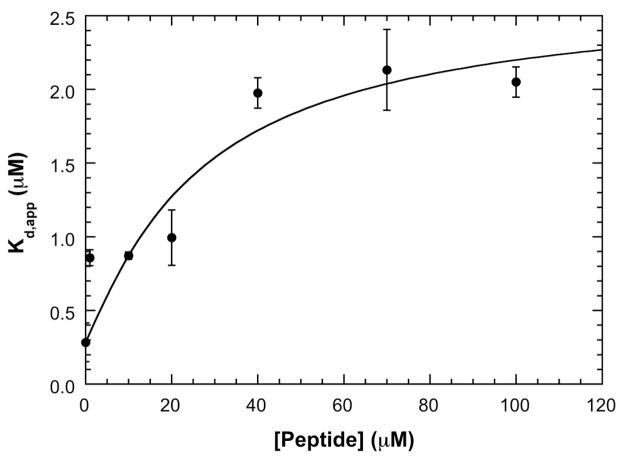
Figure 5.
Dissociation of the SecA dimer by signal peptide. A) Plot of apparent dimer dissociation constants (Kd,app) vs. signal peptide concentration. SecA dimer dissociation constants were obtained at 200 mM KCl by sedimentation velocity measurements using fluorescence optics. The solid line is a fit of the data to equation 3 performed as described in the text. The best-fit parameters are: β11 = 0.158 (μM) −1 and β22 = 0.00264 (μM) −2. This figure was adapted from reference [64].

