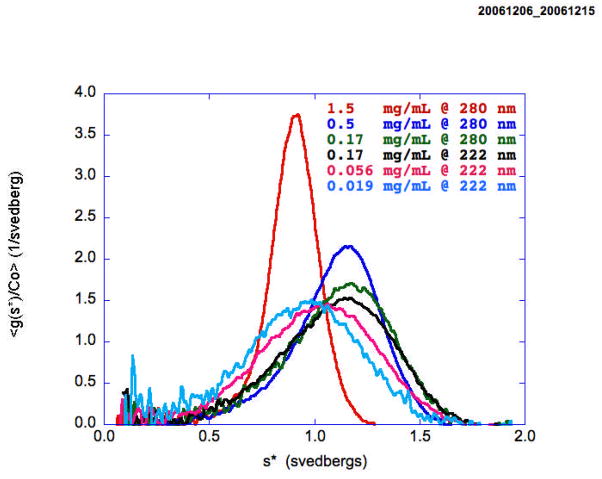
Figure 6.
Sedimentation profiles of a pegylated protein as a function of loading concentration showing the initial shift to the right at low concentrations as dimer is being formed followed by a shift to the left as the non-ideality starts to dominate the process. The three highest concentrations were measured at 280 nm and the three lowest at 220 nm with both 3 mm and 12 mm centerpieces.

