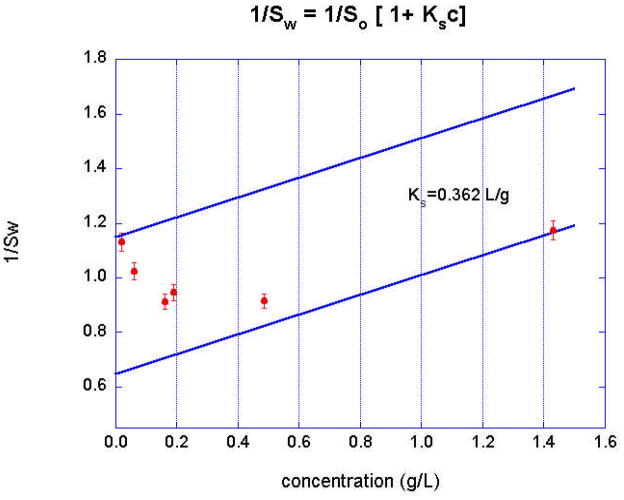
Figure 7.
Plot of inverse weight average sedimentation coefficient, 1/sw, according to equation 4 vs loading concentration, showing the effects of both association and non-ideality. The straight lines represent the expected concentration dependence of the sedimentation coefficient of the monomer and the dimer, respectively, using the value of ks obtained from the global fit (Figure 8) to all the data.

