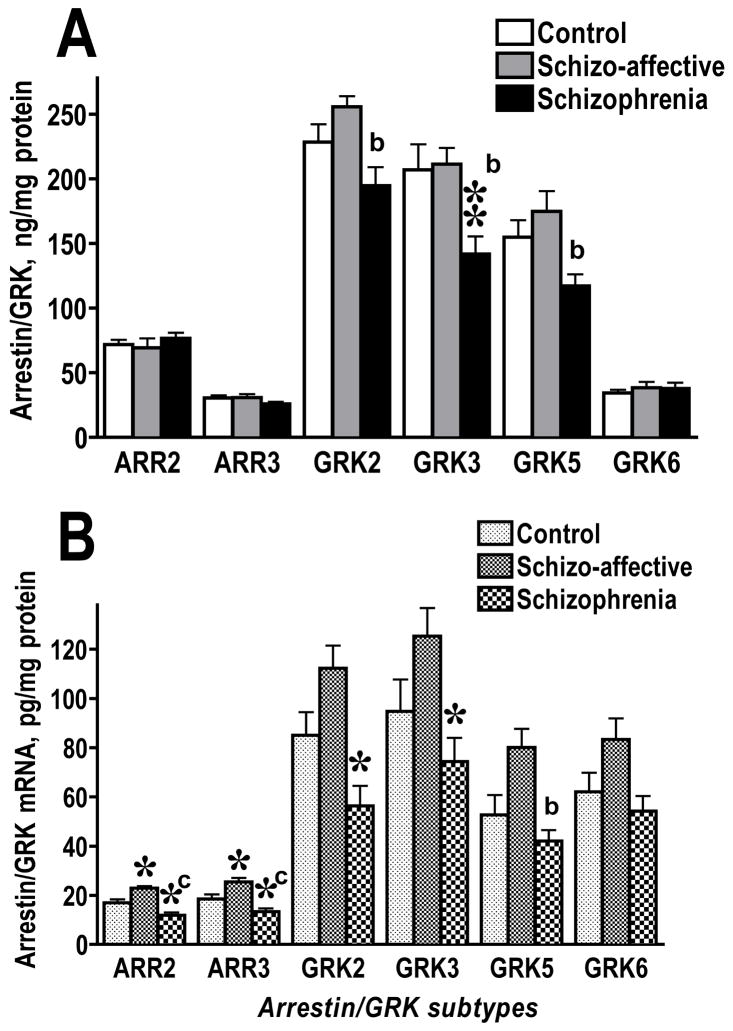
Figure 2.
Comparison of the expression of arrestin and GRK proteins (A) and corresponding mRNAs (B) in the dorsolateral prefrontal cortex (Brodmann area 9/46) in control subjects and patients with schizophrenia or schizoaffective disorder in the Harvard cohort. The data for each isoform were analyzed by one-way ANOVA with GROUP (control, schizoaffective, schizophrenia) as main factor followed by Bonferroni/Dunn post hoc test with correction for multiple comparisons. * - p<0.05, ** - p<0.01 as compared to the corresponding control values; a – p<0.05, b – p<0.01, c – p<0.001 as compared to the values in the schizoaffective group.

