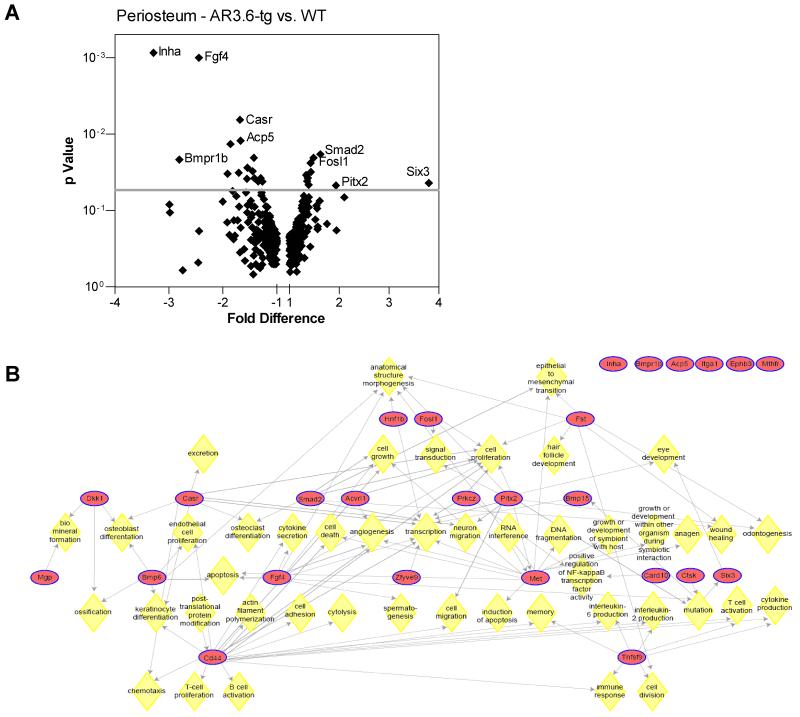
Figure 1. Gene expression differences in AR3.6-transgenic periosteal bone samples.
A. A volcano plot of significant expression differences identified in AR3.6-transgenic bone compared with WT periosteal bone. This identifies sequences that are differentially expressed as a consequence of enhanced androgen signaling in vivo. B. Pathway analyses of androgen-regulated gene expression in periosteal bone from AR-transgenic males. Significantly regulated genes expressed differentially between WT and AR3.6-transgenic periosteal bone samples were organized into functional groups to identify associations, based on biological processes using the PathwayArchitect module of GeneSpring GX 10. Biological processes are indicated by yellow diamonds. CD44 signaling is a central node for significantly regulated differences.

