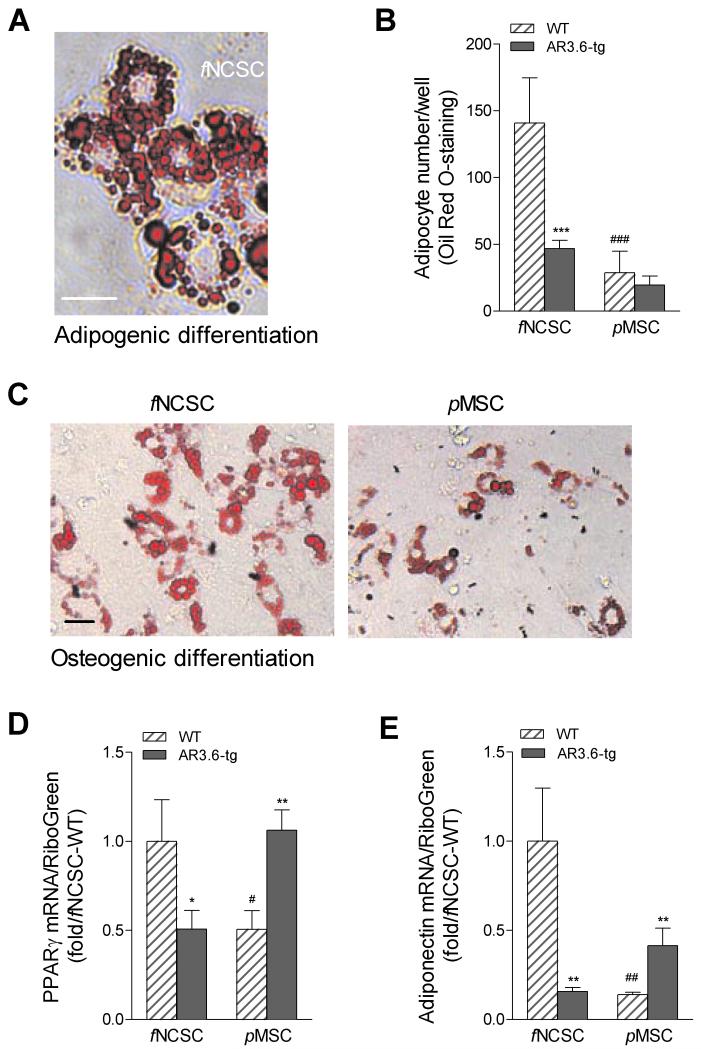
Figure 4. Adipogenesis in fNCSC vs. pMSC progenitors by Oil Red O staining.
A. Representative image of adipogenesis in differentiating cultures from fNCSC cultures after adipogenic induction as described in methods. Total magnification = 400X. Scale bar = 50 μm. B. Quantification of adipocyte numbers between WT and AR3.6-transgenic mice derived from fNCSC and pMSC cultures. Data are expressed as adipocyte number/well and shown as mean ± SD (n = 4). Two-way ANOVA for the effects of genotype and embryonic lineage showed a significant interaction, so t-test was used to determine significance. *** p < 0.001 vs. WT; ###, p < 0.001 vs. fNCSC WT. C. Adipocyte development in WT fNSCS vs. pMSC cultures after induction of osteoblastogenesis. Representative image demonstrates increased adipocyte differentiation even during induction of osteoblastogenesis in fNSCS cultures. Total magnification = 200X. Scale bar = 50 μm. Expression of adipocyte markers PPARγ (D) and adiponectin (E) was also evaluated by qPCR. Levels were determined using RNA isolated from differentiating cultures from both genotypes and both lineages as described in methods. Data are reported as mean ± SD (n = 3). Two-way ANOVA for the effects of genotype and embryonic lineage showed a significant interaction, so t-test was used to determine significance between samples. *, p < 0.05; **, p < 0.01 compared to WT and #, p < 0.05; ##, p < 0.01 vs. fNCSC WT.

