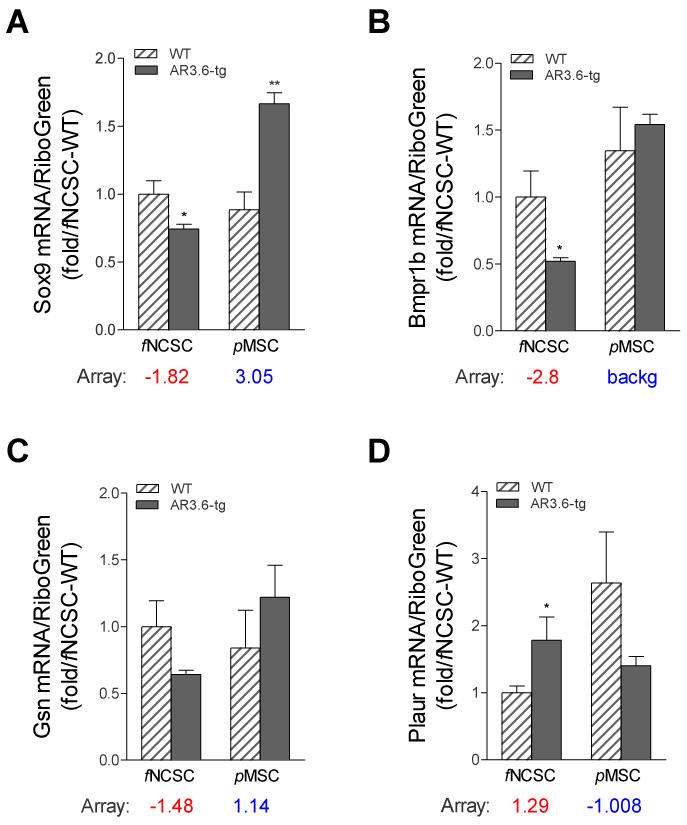
Figure 6. Comparison of gene expression from array analysis in periosteal tissue vs. fNCSC cells and cortical tissue vs. pMSC cultures.
Comparison between expression levels determined in bone samples by array results for long-bone periosteal and endocortical expression were compared to levels observed in fNCSC and pMSC cultures from both genotypes. fNCSC and pMSC cells were cultured for 10 days in osteogenic media and qPCR was performed for (A) Sox9, (B) Bmpr1b, (C) Gsn, and (D) Plaur expression. Array data is shown below each graph where red indicates qPCR array results from periosteal bone and blue indicates levels from endocortical bone samples. Each value represents the mean ± SD (n = 3). *, p < 0.05; **, p < 0.01 compared to WT control.

