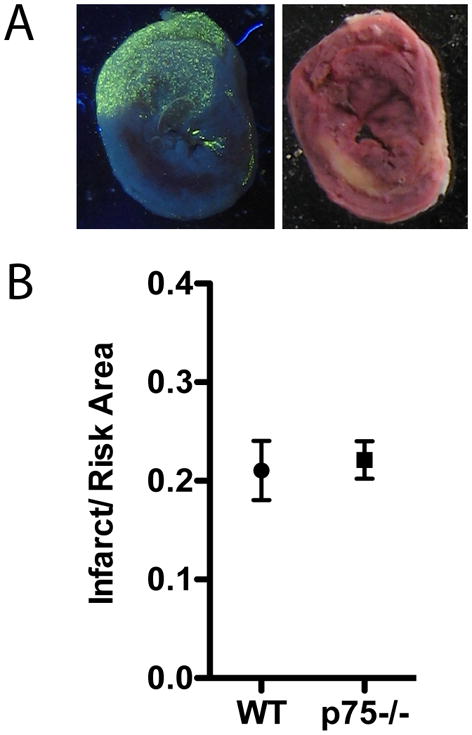
Figure 1. Infarct size compared to area at risk.

Area at risk (A) and Infarct (B) are shown from a representative section 24 hours after ischemia-reperfusion. The area at risk is devoid of fluorescent microspheres, while the infarct is yellow/white following TTC staining. C) Infarct and risk were quantified in 4 WT and 4 p75NTR−/− mice and the Mean ± SEM is shown.
