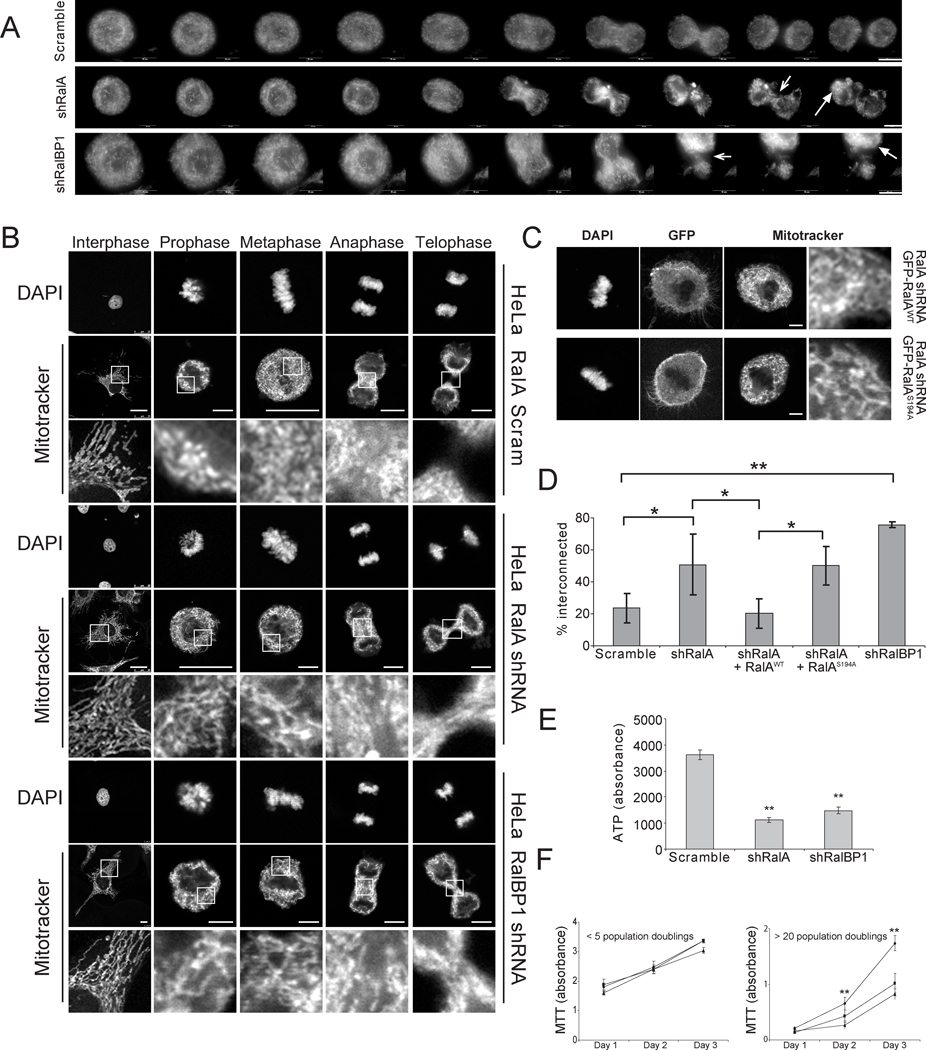
Figure 5.
Knockdown of RalA or RalBP1 prevents mitosis-induced mitochondrial fission. A Mitochondrial morphology as visualized by live cell imaging of HeLa cells stably expressing RFP-Mito and scramble control, RalA shRNA or RalBP1 shRNA after release from double thymidine block. Arrows (1, 2) indicate regions of mitochondria retained during telophase and (3, 4) unequal distribution of mitochondria to daughter cells (scale bar = 10µm). B Mitochondrial morphology visualized by MitoTracker Red staining of HeLa cells expressing a scramble control, RalA shRNA or RalBP1 shRNA at the indicated phases of mitosis upon being synchronized in mitosis using double thymidine block. DAPI staining was used to assign mitotic phase (scale bar = 25µm for scram interphase and metaphase and RalA interphase and prophase, 10µm for scram anaphase and telophase and RalBP1 interphase and 7.5µm for all other images). C Mitochondrial morphology HeLa cells expressing RalA shRNA complemented with GFP-tagged, shRNA resistant RalA in the wild type (WT) or S194A mutant configuration and captured at metaphase (DAPI) (scale bar = 10µm). D Quantitation of the percent of cells (mean ± SD, n = 3 independent experiments with ≥ 30 cells analyzed per condition) exhibiting mitochondrial elongation during metaphase. (* p ≤ 0.05, ** p ≤ 0.01) E ATP production of HeLa cells stably expressing scramble, RalA or RalPB1 shRNA was determined by measuring ATP-dependent luciferase activity measured at 560nm on a Victor3 luminometer. (The experiments were repeated at least 3 times, and each time the error was calculated from 12 replicates, ** p = 1.6 × 10⁻⁷ for RalA, 5.3 × 10⁻⁷ for RalBP1). F Proliferation of HeLa cells stably expressing scramble (◆), RalA (■) or RalBP1 (▲) as measured by MTT assay. Measurements were performed over three days using cells with fewer than 5 or greater than 20 population doublings following selection for the transgene. (The experiments were repeated at least 3 times, and each time the error was calculated from 16 replicates; day 2: ** p = 4.5 × 10⁻⁵ for RalA, 6.3 × 10⁻⁵ for RalBP1, day 3: ** p = 4.5 × 10⁻⁸ for RalA, 2.7 × 10⁻⁶ for RalBP1)

