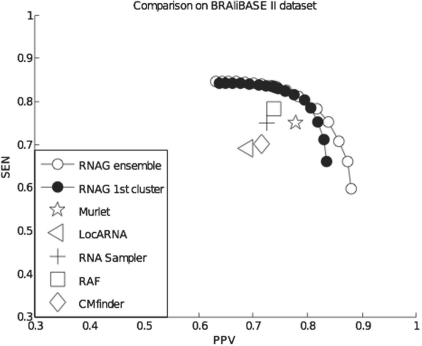
Fig. 2.
Average performance of different secondary structure prediction methods in the PPV–SEN plane for four RNA families (5S rRNA, group II intron, tRNA and U5 spliceosomal RNA) from the BRAliBASE II dataset (Gardner et al., 2005). Note: the axis ranges are set from 0.3 to 1.0 to improve readability. Points showing the performance of extant procedures were taken from Do et al. (2008) except for CMfinder, which was run at defaults.

