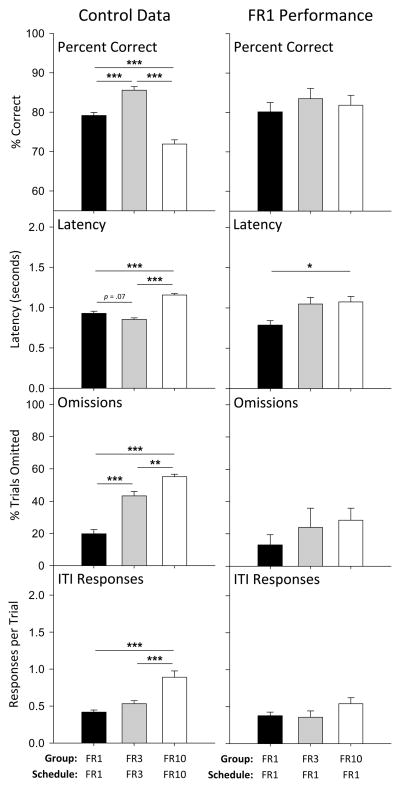
Figure 1.
Performance in the absence of any drug treatments in the FR 1 (black bars), FR 3 (grey bars), and FR 10 (white bars) groups. Control data in the left panels are the mean of the sessions immediately prior to drug test sessions, the same data that comprise the control data for statistical analyses of drug effects. Data in the right panels represent the performance of each group responding on an FR 1 schedule of reinforcement, taken from the mean of the last five sessions of responding on an FR 1 schedule either before drug testing was initiated (FR 1 group) or before FR escalation (FR 3 and FR 10 groups). Baseline percent correct, latency, omissions, and ITI responses differed among the three FR groups, and asterisks depict significant Bonferroni-corrected post-hoc tests between specific group pairings (* p < 0.05, ** p < .01, *** p < 0.001).

