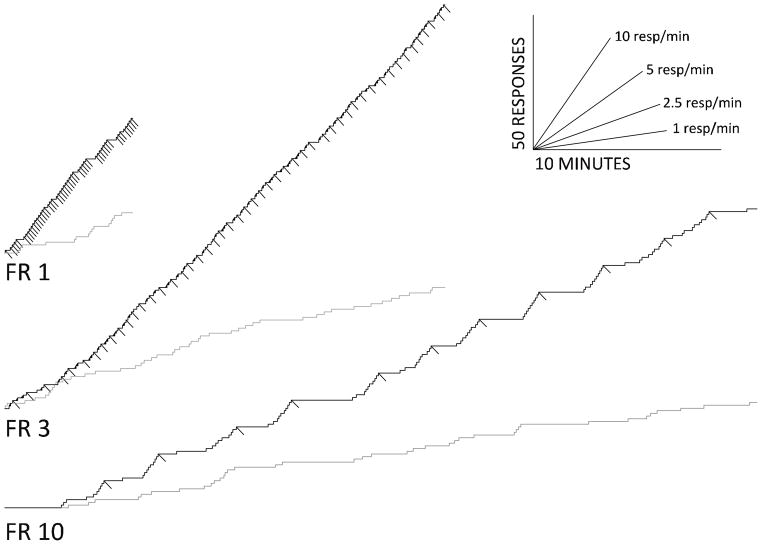
Figure 2.
Cumulative records from three representative sessions on the FR 1, FR 3, FR 10 schedules with no drug pretreatment. The black lines depict responses to the illuminated nose-poke hole during the response period and downward deflections of these lines mark pellet deliveries. The gray lines mark incorrect responses during the response period. The lines in the lower-right portion of the figure indicate scaling of time and responses, respectively.

