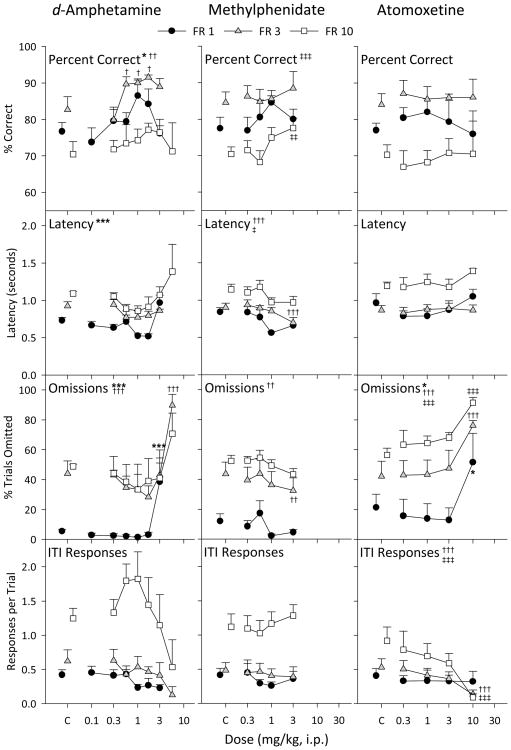
Figure 3.
Effects of drug pretreatments in the FR 1 (black circles), FR 3 (grey triangles), and FR 10 (white squares) groups on percent correct, latency, omissions, and ITI responses. The effects of d-amphetamine, methylphenidate, and atomoxetine pretreatments are displayed in the left, center, and right columns, respectively. Control points above C represent performance in sessions immediately preceding each of the drug sessions for that group, consisting of both sessions in which saline was administered or no injection was given. Significant main effects of dose for each group are represented by asterisks (FR 1), crosses (FR 3), or double crosses (FR 10) next to the panel title. Symbols next to a specific point indicate significant Bonferroni-corrected post-hoc tests for that dose as compared to the control point (one symbol, p < 0.05, two symbols, p < .01, three symbols, p < 0.001).

