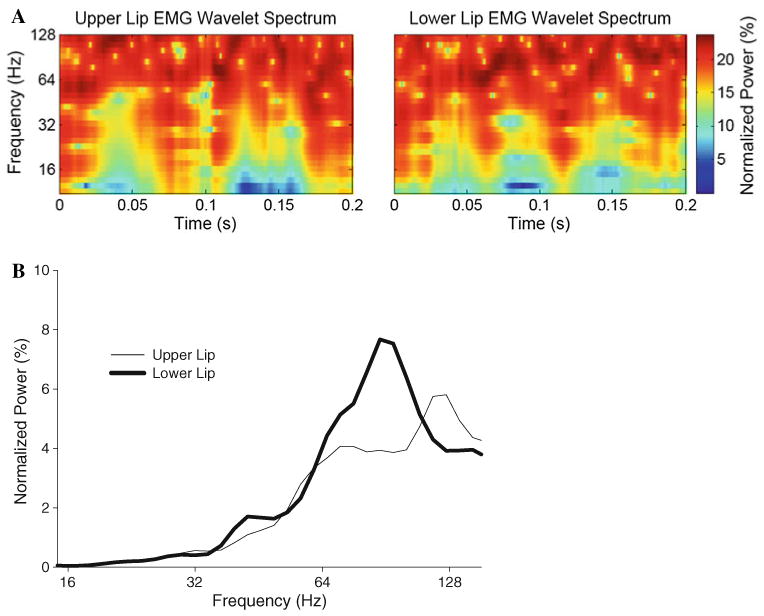
Fig. 3.

Examples of normalized wavelet spectra (a) and global wavelet power spectra (GWS, b) from the upper and lower lips EMG obtained from a young subject during a perturbed trial. The normalized wavelet spectrum shows the relative importance through time (x-axis) of the frequency content of the signal (y-axis) with intensities ranging from 0 to 100% (color coded from blue to red or white to black). The GWS shows the average intensity across time of the frequency content of the signal (thin line upper lip; thick line lower lip)
