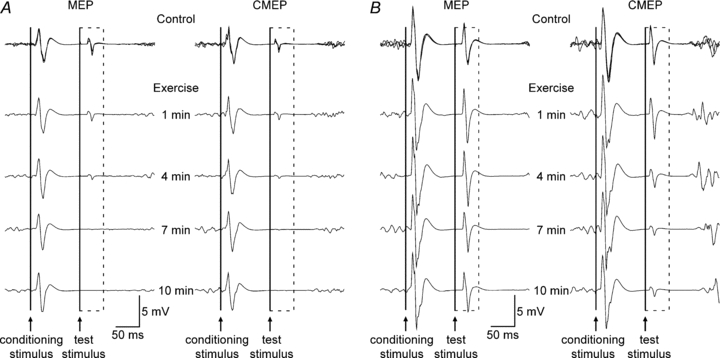
Figure 2. Individual traces of biceps EMG recorded from single subjects using weak (A) or strong (B) test stimuli.

Data in panels A and B were collected from different subjects. Responses obtained during the three brief control contractions with paired conditioning–test stimulation are overlaid. The time course of stimulation during the 10 min contraction is indicated between the two sets of traces. The dashed box surrounds the conditioned test MEPs (left) and CMEPs (right) evoked in the silent period following the conditioning TMS stimulus. The continuous vertical lines indicate the timing of the conditioning and test stimuli. A, using weak test stimuli, conditioned MEPs and CMEPs decreased in parallel. B, using strong test stimuli, the conditioned CMEPs decreased more than conditioned MEPs but this did not occur in all subjects (see Fig. 5). The suppression of both conditioned MEPs and CMEPs was less with strong than weak test stimuli.
