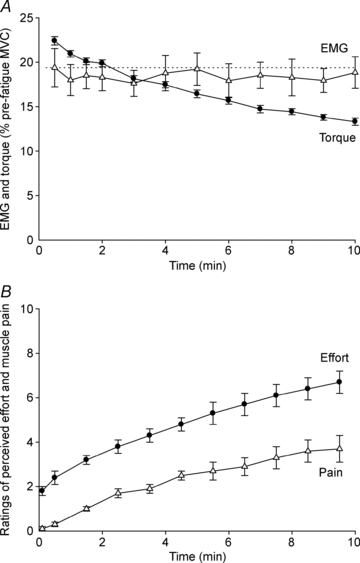
Figure 3. Elbow flexor torque and biceps RMS EMG (A) and ratings of perceived effort and muscle pain (B) during a submaximal maintained-EMG contraction.

Data are mean values (± SEM) of the four protocols. A, elbow flexor torque (•) and biceps RMS EMG (▵) obtained over 100 ms just prior to each unconditioned test stimulus. Both variables are expressed as a percentage of their value during the pre-fatigue MVC with the greatest peak torque. B, ratings of perceived effort (•) and muscle pain (▵) collected using an 11-point Borg scale.
