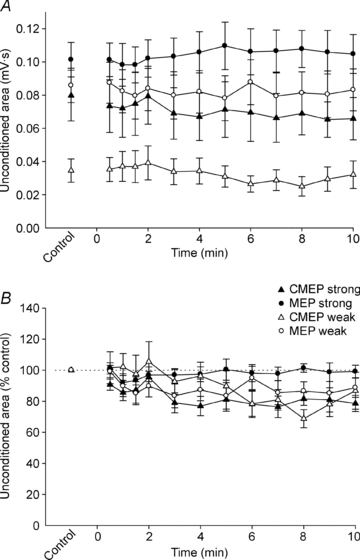
Figure 4. Unconditioned test potentials during a submaximal maintained-EMG contraction.

Data are mean values (± SEM) for unconditioned MEPs (○) and CMEPs (▵). Open and filled symbols show data from protocols with weak and strong test stimuli, respectively. A, absolute area of unconditioned MEPs and CMEPs. B, areas of unconditioned MEPs and CMEPs are normalised to Mmax recorded 10 s later and then expressed as a percentage of the mean normalised value obtained during the control contractions.
