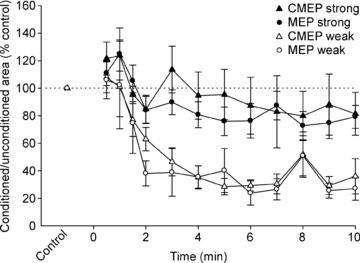
Figure 6. Ratio of conditioned to unconditioned test potentials during a submaximal maintained-EMG contraction.

Data are mean values (± SEM) for MEP (○) and CMEP (▵) inhibition ratios. Open and filled symbols show data from protocols with weak and strong test stimuli, respectively. The ratios of conditioned to unconditioned potentials are expressed as a percentage of the mean value obtained during the control contractions.
